 This page is
under construction...
Last modified July 31,
1997

Manual
Michael A. Charleston, Division of Environmental and Evolutionary
Biology, Institute of Biomedical and Life Sciences, University of Glasgow,
Glasgow G12 8QQ, Scotland, United Kingdom.
Tel: (0141) 330 5346, fax: (0141) 330 5971.
e-mail: m.a.charleston@bio.gla.ac.uk
Introduction to Spectrum
This section is divided into three
parts: "What is a spectrum?", "What is the Closest Tree?", and "What is the
Manhattan Tree?".
What is a spectrum?
A spectrum is a representation of all the
inferred or estimated branch lengths of a phylogenetic tree, without the
necessity of actually inferring a tree. For "good" data, that is, data which
corresponds exactly to a particular phylogenetic tree without any conflict, the
spectrum will show positive values only when they correspond to branches of that
tree, and all the others will be zero. With n taxa and a fully resolved
unrooted tree, this amounts to (2n-3) branches, n of which are
pendant (often called 'leaves') and the other (n-3) of which are
internal.
With n taxa there are 2^(n-1) ways of splitting the taxa into
two parts, which are frequently called splits. These are all potential
branches of phylogenetic trees, from which we must select a set (or sets) of
splits to construct estimates of the real phylogenetic tree underlying the taxa.
You are urged to read the 'Technical bits', next.
Technical bits:
For a given set of sequences of aligned
characters, each character being in one of two possible states,
the sites along the sequences corresponding to hypothesized homologous
characters across the taxa each divide the taxa into two sets.
Example:
As an example we consider the bacteriophage T7 data generated
by Hillis et al. (1992). The binary characters in this data set are
variable restriction enzyme cleavage sites. Not all data from that set are used
here --- the four sites in which the relevant site was deleted in one or more of
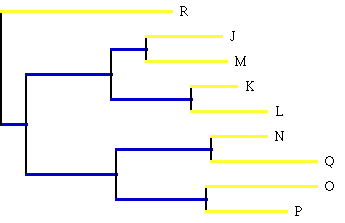
the lineages were left out. The true tree for the nine lineages is shown in
Figure 1 (R is the outgroup).

Figure 1: The branch lengths are drawn to scale with the number of changes
of character state which took place during the evolution of the
bacteriophage.
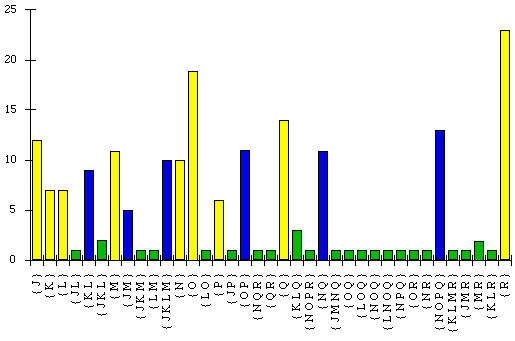
The raw spectrum corresponding to the T7 data is presented (apart from the
zero values) in Figure 2.

Figure 2: Raw spectrum calculated from the bacteriophage T7 data
Only those splits with at least one site supporting each are shown.
It is not always the case (in fact it is almost never the case!) that all
sites in real biological data do in fact correspond to the same tree, since
there may well be other random or unknown effects of the evolutionary process
evinced in the data. This behaviour gives rise to the large number of splits in
the above spectrum, only 6 of which can correspond to any single tree, yet which
are observed in the data.
The splits are indexed using a scheme invented by M. D. Hendy (1991). First
the characters are recoded if necessary so that at each site, the n-th
character has state '0', and the characters which are not the same as that of
the n-th are coded '1'.
The split to which the site corresponds is labelled with the binary number
whose expansion is the array of characters states from the n-th down to
the first, as follows:
	Enzyme/Site HpaI/7752:
		individuals	J K L M N O P Q R
		state		+ + + + - - - - +
	Recoded to '0's and '1's:
		011110000 (binary) = 240 (base 10).
The splits shown in Figure 2 are from the "raw spectrum" obtained from
the T7 bacteriopage data. By operating on the spectrum with the Hadamard
Transform of Hendy et al. (1994) we can calculate estimates of the
lengths of branches within the tree which gave rise to the observed data. In
this case the hypothesized model of character evolution is the very simple
two-state symmetrical Markov model of Cavender (1978), in which the characters
evolve stochastically in time at a constant rate, and the probability of each
character changing from state '+' to state '-' is the same as the probability of
changing from '-' to '+'. With such a model we can estimate the number of
character state changes that must have occured on each branch of the tree to
account for the observed data, 'correcting' in a sense for multiple changes.
In the ideal case with no sampling error and when the hypothesized model
accurately reflects the true mechanism, then this calculation will reveal the
number of character state changes per site on each branch of the tree, so the
resulting spectrum will have entries which are positive only when they
correspond to splits in the generating tree.
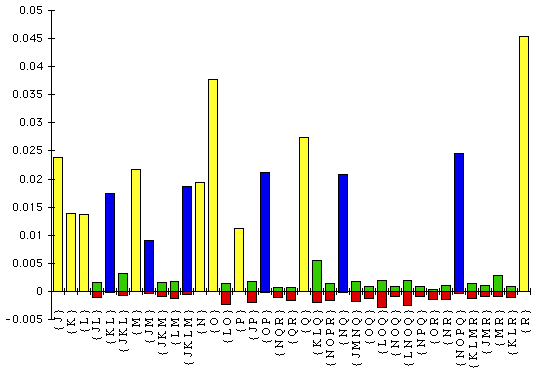
Figure 3 shows the set of entries greater than 0.0001 in the Hadamard
conjugated T7 bacteriophage spectrum. To obtain positive entries for the natural
log part of the transform, it was necessary to include some constant sites. In
the current implementation of Spectrum, this must be by inserting columns into
the original data matrix: there is as yet no mechanism for adding a number of
sites which are constant otherwise.

Figure 3: Hadamard log spectrum calculated from the bacteriophage T7
data
Only those splits with estimated length more than 0.0001 are shown. (The
length is the expected number of character-state changes per site.) The parts in
red are the relative amounts of conflict that each split shown has with the rest
of the data: the singleton splits (in yellow) have no conflict, and it is clear
that those splits in the true tree have very little conflict.
What is the Closest Tree?
The Closest Tree (Hendy, 1991) is that tree
whose expected spectrum is the closest to that which we obtained from the data.
Since the spectrum is a vector of 2^(n-1) real components, finding the
closest tree is equivalent to finding the (2n-3)-dimensional hyperplane
in the 2^(n-1)-dimensional real space whose axes correspond to the
possible splits of the n taxa, which is the closest Euclidean distance to
that point given by the spectrum. Luckily this can be achieved relatively easily
with a Branch-and-Bound search, which is feasible for up to about n = 20
taxa. In this implementation of Spectrum, the maximum for n is 18,
to keep memory requirements down.
What is the Manhattan Tree?
The Manhattan Tree is that tree whose
expected spectrum is the closest Manhattan distance to the spectrum we
obtain from the data. Another name for Manhattan distance is city-block
distance. The closest tree and the Manhattan tree tend to be very similar,
though finding the Manhattan tree is slightly less time-consuming.
Operation of Spectrum
The interface of Spectrum has been
markedly improved in its interface, through the extensive programming help of Rod Page. The command format
is now completely different, though the underlying operation remains basically
the same.
Input of data
The data used by Spectrum are read in directly from
an input file, which can be anywhere... The input file must be in the
fast-becoming-standard Nexus format of Maddison and Maddison (1995), as is used
by programs such as MacClade and PAUP.
Limitations
There are limitations with everything. Spectrum is
limited in the number of taxa with which it can cope, by memory requirements.
I've perhaps arbitrarily decided to keep the memory down to about 4Mb, which is
of course completely miniscule when compared with, say, Microsoft Excel. If you
feel that more taxa are required, let me know and I can modify the program.
Bugs
Though major improvements have been since the original versions,
there may remain bugs in the code. Please let me know if and when you find
any, and make sure you give details of when the problem occurs. There is a short
history
of updates and bug fixes which have been made to Spectrum, for interested
parties.
Registration
Please register your copy of Spectrum! It costs nothing, and
if you register I can keep you up to date with bugs, bug fixes, updates etc. E-mail me to register.
References
- Cavender, J.A., 1978. Taxonomy with confidence, Mathematical
Biosciences, 40:271-280.
- Hendy, M.D., 1991. A combinatorial description of the closest tree
algorithm for finding evolutionary trees. Discrete Mathematics,
96:51-58.
- Hendy, M.D. and Penny, D. and Steel, M.A., 1994. A discrete Fourier
analysis for evolutionary trees. Proceedings of the National Academy of
Sciences, 1994.
- Hillis, D.M., Bull, J.J., White, M.E., Badgett, M.R., and Molineux, I.J.,
1992. Experimental Phylogenies: Generation of a Known Phylogeny.
Science, 255:589-592.
- Waddell, P.J., Penny, D., Hendy, M.D., and Arnold, G., 1994. The sampling
distributions and covariance matrix of phylogenetic spectra. Molecular
Biology and Evolution, 11(4):630-642.
 Back to my home page...


 Back to my home page...