In the first cycles of the DNA amplification in DIAPOPS
A comparison of PCR products in liquid - and solid phase
1. Introduction
In the first cycles of the DNA amplification in DIAPOPS ![]() ), PCR products are only synthesized in the liquid phase. When enough liquid phase products are created, they will start to recognize the solid phase primer, and the solid phase amplification is initiated
), PCR products are only synthesized in the liquid phase. When enough liquid phase products are created, they will start to recognize the solid phase primer, and the solid phase amplification is initiated ![]() )
)
2. Data from a comparison between DIAPOPS and liquid phase product concentration
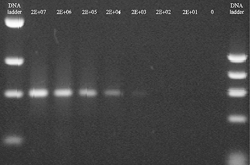
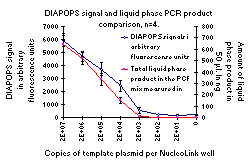
Figures 1 and 2 present results from both DIAPOPS and liquid phase product concentration from two different systems. With both of these systems, as with all other systems tested, there is a good correlation between the DIAPOPS signals and the liquid phase product concentration, and all bands detected on agarose gel are detected with DIAPOPS. The system shown in Figure 1 yields a better detection limit with DIAPOPS compared to the agarose gel whereas the system shown in Figure 2 yields identical limits of detection with both liquid phase agarose gel electrophoresis and DIAPOPS.
3. Difference between standard symmetrical PCR and asymmetrical PCR
The gels presented in Figures 1 and 2 show PCR products from reactions from an asymmetrical PCR ![]() )
)![]() )
)![]() )
)![]() )
)
  Figure 2: The left-hand picture shows the analysis of liquid phase PCR products on an agarose gel. The right-hand diagram shows the corresponding DIAPOPS signals and the quantifications of the liquid phase PCR product. The quantification were calculated from the gel shown as well as three identical gels. The template was a dilution series of plasmid DNA and the numbers above the lanes on the gel picture and on the X-axis of the diagram show the number of plasmids added to each NucleoLink well. In the samples with 2,000 copies added, faint bands were observed on the gel from three of four samples. However, the scanning equipment could not detect these faint bands. The DIAPOPS clearly detected the three gel positive samples, but was negative with the fourth gel negative sample. The system has an annealing temperature of 55ºC and uses 40 temperature cycles. With this system the gel and the DIAPOPS have identical detection limits. |
4. Conclusion
The concentration of the solid phase product, and therefore also the hybridization detection in DIAPOPS is directly correlated to the liquid phase amplification. The ratio between the amount of solid phase products and the concentration of liquid phase product is not maintained between DIAPOPS systems. Therefore, no fixed ratio between the DIAPOPS signal and the actual amount of liquid phase PCR products can be given.
Concentration of liquid phase PCR products in a standard symmetrical PCR is normally the same or only slightly higher than the liquid phase PCR product concentration in an asymmetric amplification used in DIAPOPS ![]() )
)![]() )
)