After the temperature cycling program, the NucleoLink Strips are removed from the thermal cycler for detection by hybridization
Analysis of the method for denaturation of the solid phase amplicons after PCR
1. Introduction
After the temperature cycling program, the NucleoLink Strips are removed from the thermal cycler for detection by hybridization ![]() )
)![]() )
)![]() )
)
The solid phase PCR product will be double-stranded in the empty NucleoLink Strips because the template strand remains hybridized to the solid phase strand ![]() )
)![]() )
)![]() )
)
The NaOH concentration, the number of washes, the soak time of the individual washes, and the temperature of the washing buffers are all important in the denaturation of the solid phase product. If the denaturing treatment is too brusque, the solid phase product might be damaged. If the treatment is too mild, not all the solid phase products will be denatured. As a consequence of inadequate denaturation, the subsequent detection by hybridization will not be optimal. The signal will be too low, which can also be the result of too harsh denaturation.
2. Presently used method for denaturation after PCR
The denaturation used in the DIAPOPS procedure ![]() )
)
3. Problems with presently used method for denaturation after PCR
In some test systems the samples with the highest template concentration occasionally showed an unexpected decrease in DIAPOPS signal in relation to lower dilutions, which is illustrated in Figure 1. The corresponding analysis of the liquid phase products on an agarose gel ![]() )
)
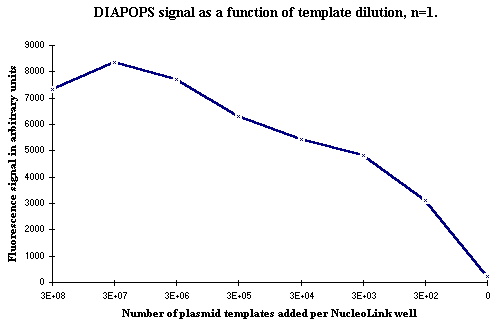 Figure 1: DIAPOPS results from a dilution series. Notice the decrease in signal in the sample with the highest template concentration. |
When the strips with immobilized amplicons from some test systems were analyzed more than once by hybridization ![]() )
)![]() )
)
Two different salt concentrations were tested in the wash after hybridization ![]() )
)![]() )
)
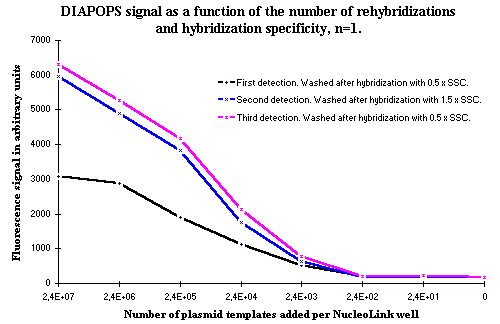 Figure 2: Effect of rehybridizations. As seen, the decrease in hybridization specificity, controlled by the higher SSC concentration in the second wash, does not affect the results. The repeated hybridizations are the reason for the higher signals observed in the third hybridization where the low salt concentration of 0.5 x SSC was used. If the higher signals were a result of the higher SSC concentration, it would be expected that the curve from the third hybridization would be identical to the first hybridization. |
The higher salt concentration does not change the results. The reason for the increase in DIAPOPS signal in the second wash is not a consequence of the salt concentration, which is seen in the third hybridization detection, which has low salt concentration. The signals from this hybridization is, in spite of the lower salt concentration, still as high as hybridization No. 2.
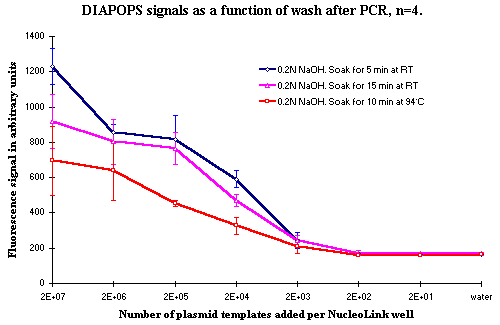 Figure 3: DIAPOPS results from three tests, where the soak time and temperature in the denaturation wash after PCR was changed. |
4. Denaturation after PCR with NaOH at higher temperature, higher concentration and prolonged soak time in the wash
A number of tests were made to optimize the conditions in the denaturation of the solid phase product after PCR. Figures 3 and 4 show DIAPOPS signals from the first hybridization after PCR with three different NaOH denaturation conditions. The incubation time, the incubation temperature, and the concentration of NaOH were modified.
Data presented in Figures 3 and 4 indicates that increasing the concentration of NaOH from 0.2 N to 0.4 N will result in a decrease of DIAPOPS signals from the higher template concentration. It will also decrease the signal if the temperature is raised to 94ºC. If the soak time is raised to 15 minutes, a slight decrease can occur. When two soakings for 5 minutes are used, a result similar to the standard wash is seen. Figure 4 indicates that a double soak for 5 minutes slightly increases the signal. However, this was not incorporated in the standard procedure because it was not statistically significant, and because it would prolong the procedure.
The NucleoLink Strips used for the experiment shown in Figure 3 were re-analyzed using rehybridization ![]() )
)
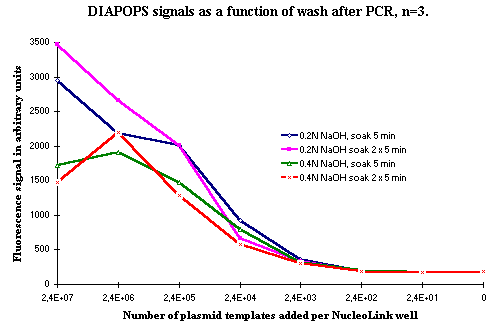 Figure 4: DIAPOPS signals as a function of wash after PCR. Error bars are not included due to the closely spaced curves. |
5. Denaturation after PCR using hot hybridization washing buffer
A wash with 0.5 x SSC at 94ºC for 5 minutes, followed by quick removal of the hot washing liquid was also tested and compared to the standard NaOH wash. The results from this experiment are presented in Figure 5.
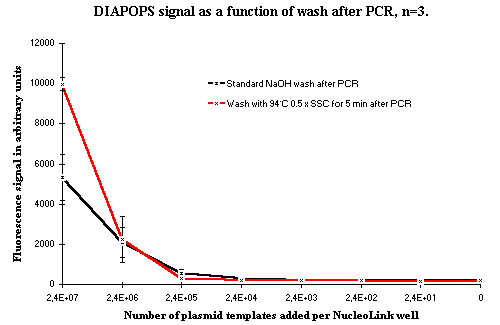 Figure 5: DIAPOPS signals from dilution series as a function of the wash after PCR where the double-stranded solid phase products are made single-stranded. The standard NaOH wash at RT is shown in black, and the red line shows the results from a wash with 0.5 x SSC for 5 minutes at 94ºC. Figure 5: DIAPOPS signals from dilution series as a function of the wash after PCR where the double-stranded solid phase products are made single-stranded. The standard NaOH wash at RT is shown in black, and the red line shows the results from a wash with 0.5 x SSC for 5 minutes at 94ºC. |
It is indicated from the results presented in Figure 5 that signals from the samples with the highest template concentration are improved by using the wash with 94ºC hot 0.5 x SSC. However, at lower concentrations this improvement is not observed. With the low template concentrations, the standard wash gives the best detection limit. These results from the samples with the highest template concentrations confirm the theory that the standard 0.2 N NaOH treatment at RT does not denature all the solid phase products in the first denaturation after the thermal cycling.
However, the standard denaturation with 0.2 N NaOH at RT gives the best detection limit. For this reason, a wash at 94ºC, such as the hot buffer wash and the wash presented in Figure 3, must remove or destroy some of the solid phase products. Furthermore, the hot wash is difficult to perform. The hot wash buffer must be quickly removed while it is still hot. This hot washing procedure is inconvenient when analyzing a large number of samples.
6. Conclusion
The standard NaOH denaturation method with a concentration of 0.2 N at room temperature is the best choice, even when the samples with the highest templates concentration do not give their true value with a limited number of systems in the first hybridization. However, all positive samples are detected, and the limit of detection is not altered.